Share the awesome

AI PBLI’m not gonna lie. When DTHub asked if I could share my story about a recent PBL unit with IST, I squealed with excitement. Validation, right? Usually I just share here but DT Hub has a much bigger audience than my blog!

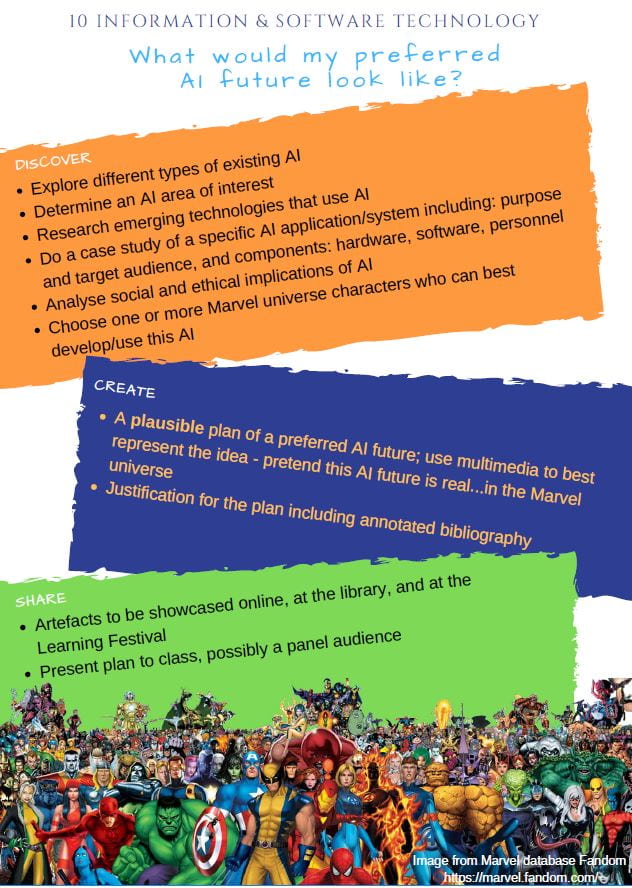
The story is up – What would my preferred AI look like?  There’s no point re-posting here so please go there to read the story, download resources including assessment task details, and  view exemplars – plus some tips on adjustments you can make to it.

I was excited planning this PBL and tweeted this poster on the left a lot. Running it got frustrating at times – as projects sometimes (often?) do. But the students engaged, and persevered, and rose above feelings of confusion and frustration. The result was a triumph in teaching and learning which I was glad and proud to share more widely.

The story in DT Hub is not complete though. There are more awesome stories to tell, e.g.

  • a student who previously struggled with completing assessments on time, if at all, did so this time
  • a student who spent an inordinate amount of time on one aspect of the project, to the detriment of some of her other subjects reminds me that, like adults, students juggle and prioritise and will go beyond expectations when motivated by personal interests (that’s a long sentence!)
  • a recent Twitter connection, Erica Southgate, whom I’ve not personally met (yet) connected ESA/DTHub and me. What little she knew of my work, she thought good enough to be worth sharing. Awesome, right?
  • some parents of these girls told me how it opened up interesting discussions at home AND some even offered opportunities like excursions and connections to other IT professionals. Yay!
  • the hope @smerity gave us regarding ‘dual use technology’ such as AI: while we cannot eliminate the bad, maybe we can drown it out with the good. As a tech teacher, I live for this hope, that my students will believe they can help build a preferred future (yes, I’m assuming it is good)!

That last point is a salient one and the reason for the blog post title. There are so many negative stories around and it’s important to share positive ones. I really believe that everyone has awesome stories to share: face-to-face or online.

We all need to share more of the good stuff because this is the stuff that gives us – and our students – hope for a better future, and that education can help us get there. I think this quote I shared on my post about (action-research on) hope is appropriate to re-share:

…if openly shared and freely distributed, hope can spread throughout the community. –  James Arvanitakis

#ShareTheAwesome


Someone gifted me this perspective a while ago as I battled with impostor syndrome (this nasty voice inside that refuse to just leave me alone for good). Putting this video  here again in case you need it to be convinced that you have something awesome to share. We all do.

Data Data Data

Data fascinates me. Ironically, much as I enjoyed mathematics in high school, I did not enjoy Statistics and Probability – strands that haunt me particularly in my professional life. Another ironic thing is that while I enjoyed working with databases in my previous career in IT (I love SQL), I’ve not really ‘taught’ databases in high school computing in a way that genuinely shares this joy.

This post is not about Stats, Probability, or databases but rather something more fundamental.

This post is about data and, in particular, some novel ideas I’ve heard/read lately about what data is…and I’m fascinated even more!

3 ways to spot a bad statistic

in this TED talk, Mona Chalabi is charmingly entertaining as she unpacks the problem with polls and averages, as well as people’s perception of data. The thing about averages is not new to me but I love her (new to me) rationale for her hand-drawn visualisation which strengthens her strategies for spotting dodgy data. I teach these data concepts but I love the (new to me) way of framing them.

Can you see uncertainty?

There’s usually a big emphasis on data accuracy and precision (oh the beauty and irony of floating point representation in computers). Chalabi points out this problem when dealing especially with human behavioural data (ha! Recall my action-research on well-being). And truly, sometimes we got hung up on quantification and numbers, sometimes losing sight of the real story the data is trying to tell.

Can you see yourself in the data?

The second point is interesting because it’s not just about whether data is personally relevant. But rather, it’s to do with granularity and visualisation techniques, particularly when only aggregated data is shown. People cannot be summed into one data point so it makes sense to look for other data points or perspectives or axes, e.g. over time or split into gender.

How was the data collected?

If there’s anything I learnt from working with decision-support systems it’s this, be careful what questions you ask as the answers you get may not be what you’re after in the first place…and the good ‘ol “rubbish in, rubbish out“. This point is certainly about the source and process of data collection but more importantly, it is about data integrity.

Data Humanism

I stumbled on this term as only one can in the wonderful world of hypertext. Internet serendipity is a thing! This post on Data Humanism by Giorgia Lupi was an eye-opener.

Data Humanism by @giorgialupi

Connect data to what they stand for: humans – people, behaviour, knowledge

Lupi extols ‘Embrace complexity’. Here I am, schooled in the idea of ‘keep it simple so the audience gets it’ but,

We can write rich and dense stories with data. We can educate the reader’s eye to become familiar with visual languages that convey the true depth of complex stories.

And here’s me scratching my head why school reports show a bunch of numbers and letters, maybe some written comments, that quite often fail to tell the ‘true depth of complex stories’. Context is usually missing because (I know) it’s in the ‘too hard basket’.

So, here is the challenge I’m setting for myself:

Data, if properly contextualized, can be an incredibly powerful tool to write more meaningful and intimate narratives.


I’ve got such a long, arduous and exciting learning journey ahead of me!


Teaching Thinking

There are currently a couple of initiatives at my school that target thinking as a skill; I’ve been fortunate enough to be somewhat involved in both..

One of these is using the Philosophy framework, i.e. Socrates’ “Logos, Pathos, Ethos” to unpack how we think when faced with situations where we need to make decisions or we need to be persuasive. In a nutshell, what is at the forefront is logical reasoning for Logos, emotions for pathos and ethics, character and wisdom drawn from experiences for ethos. This is a simple framework that is very accessible for year 9s to whom this initiative is targeted.

Another one uses the neuroscience framework, i.e. “Pre-frontal Cortex (PFC), amygdala and hippocampus” – parts of the brain. In a nutshell, amygdala is responsible for our ‘flight or fight’ response or when we allow our impulses and emotions to rule our behaviour and thoughts. The hippocampus is in charge of storing our memories, like a scrapbook of our lives. The PFC – which is not fully developed in adolescent brains – takes care of thinking and decision-making and so, moderating our behaviour. This framework is very accessible for year 8s to whom this is targeted.

In Software Design and Development – and really many (all?) subjects, students need to think logically particularly when critically analysing, evaluating and making recommendations. In SDD, we look at software from the perspective of users and developers and yet I’m finding that my students are not leveraging their extensive experience using software to inform their thinking. Seems like such a waste of resource, right?

So, I told them about the 2 frameworks above. The idea is that the frameworks provide them with another way to view contexts. For example, when they struggled to name features of a banking system, a prompt using their own experience in banking opened a flood of features in far greater detail…and stories (gotta love those). A student who often struggles with staying on-task and is regularly disruptive was also quick to change when prompted with “you’re letting your amygdala rule; try a bit more PFC”.

In our last lesson discussing software installation methods, a richer discussion was had as students were challenged to think of examples drawing from their experience and how they may have felt (connecting to another syllabus content: impact of software to users). And so then, the logic of choosing one method over another makes more sense, from a social-ethical perspective. It may well merit adding to my list of ways to teach empathy.

I’m under no illusions of the impact or permanence of these changes.  What I’ve done is planted seeds that I hope to nourish in the next few terms as I help my students face the HSC and the wider world beyond. I’m teaching them to draw deep into resources within themselves as a way to connect beyond themselves (is any other way possible?). Teaching thinking skills is all part of building student agency.

This may be an unconventional approach to teaching the syllabus but for me, it makes sense. It aligns with my own industry experience and consequently, vision of introducing more of humanities into learning about and creating digital technology.

Art to express dyslexia

A year 12 student approached me today for help on sound editing as part of her HSC major work for Visual Arts.  As usual, I started off with my question, “What do you want to do?

As it turned out, Claire (not her real name) was creating a multi-media piece. She described how she wanted to layer audio tracks, edit those, add effects, etc. The point was to make multiple speaking tracks sound like noise (This is a digression but if you want to learn how amazing our brain actually works to split out concurrent sounds so we can focus on say someone talking while traffic goes past and music blares, watch this video).

I suggested Audacity.  I explained that this tool allowed her to import tracks, edit those separately and merge to make one joint sound.  And she goes, “like Photoshop for images”.  This is connectivist learning in action. By the time I got to saying you have to save the project file while working on it and then do a final export, she had already made that connection.

But that’s just the technical and pedagogical part of this story.  Here’s the human side.

I asked to see the video part of her work.  She showed me a series of Flash videos of basically moving text on different coloured backgrounds.  We went through pink, yellow and finally blue and green.   When the blue and green panes merged, the text stood still and she said that these videos showed how she sees text.

I then asked, “do you have Irlen dyslexia?”  She was rather surprised that I even knew of it before admitting yes.

I went on to say that I had a student once in my maths strugglers class who had it and how I had to create special paper copies for her, especially of quizzes and tests.  After a few months, it became clear that this kid was not a struggler in maths at all and I was able to recommend for her to move up and that’s where she stayed.

Claire appreciated that story and she said, “people think we’re dumb or stupid but we’re not really. It’s just really hard when reading is such a struggle.” She went on to say that she wants to raise awareness of her condition which is why her major work is on it.  Already, her peers are appreciating what she’s doing and the struggle she’s been through and still going through.

I had tons of questions and Claire happily answered them.

I found out that when she first got the right pair of coloured lenses in year 6, she literally jerked back.  When asked whether the colours were making the letters jump she replied, “No, they’re standing still”.  She said that was the first time ever that words did not literally jump at her.  She talked about struggling with letter recognition because a still “t” just did not look like the squiggly “t” she’s grown to know, for example.

She also explained that it’s not so much a problem with text as with contrast.  The higher the contrast, the bigger the struggle.  This was why black text on white paper was the worst possible combination for those with Irlen dyslexia.  Coloured paper and lenses help reduce the contrast and therefore keep the text still enough to be read.  For computers, she uses a screen guard.  She also talked about some of her own strategies to compensate such as developing something on coloured background and transposing on white ready for submission or sharing.

By then, I felt bold enough to ask “And you chose Visual Arts?” (Being a frustrated artist, I know the challenge a blank canvas brings) What bigger contrast is there than the first stroke on a blank canvas? You know what she said?

“I love colours so I just persevere until I get beyond those first strokes and get to apply the colours I like”.

I can tell you, I learned more in this encounter than this kid did….and she came to me for help!  She left extremely grateful for my help, nonetheless, and I think it was more than just Audacity.

Thank you Claire. Good luck with your major work.

The world needs more people like you.

Keep sharing your story.

Be proud of your journey.

UPDATE

Claire was really happy to see this post and even more when I mentioned she has touched many more (this is one of my most popular posts).

With her permission, I’m embedding here the video mentioned above (sorry for the big logo overlay as it’s all I could do to convert her Flash swf to a movie – had to convert for technical reasons).

This video is only part of her Visual Arts work. If you look closely, there are some of her other pieces included in the movie – the colourful artworks and the text that looks like barcodes.  Currently, her colour is blue-green, i.e. the colour she sees clearly with.

DyslexiaArt from Malyn Mawby on Vimeo.

DyslexiaArt – click to view if embed doesn’t work on your browser

Here is another story of how art is used for self-expression and ultimately social connection.  Read about Steve by Tomaz Lasic.


Story-telling

I just read this story-telling post by @billgx which inspired me to write this post; it’s’ been a while, I know!

Bill’s post has just highlighted the power of stories – something I’ve been tossing around in the old brain for a while.  I thought it best to capture just a few of these thoughts for future use in teaching and learning.

We are always telling stories. Stories don’t have to be oral or written narratives. Just yesterday in my digital photography workshop, I alluded to photos as telling (or capturing) stories. It is sometimes difficult to glean the story depending on the medium used but the story is definitely there.

We enjoy listening to stories. Stories can be affirming with a by-product of connecting the audience to the story-teller – or the content itself.  I still remember when I told a class about Descartes before launching into the Cartesian plane. As a teacher, listening to our students’ stories afford us a glimpse to who they are and knowing students is important for good teaching and learning to happen.  Ditto for students.Here is a story-writing exercise I once did with a class just to get the creative juices flowing:

  1. Give each student a piece of paper.
  2. Everyone starts off with the same line, e.g. “Today as I got to the school gates….
  3. Then, everyone passes the paper to the left (or right) and then write a sentence to continue on.
  4. Continue the round robin, with prompts for introducing the ‘problem’ or ‘resolution’ or ending. 

Make sure you make time to read a few out or perhaps publish the stories. Depending on the age group, it might be necessary to establish some ground rules as you would for anything ‘anonymous’.

This might even be useful in a maths class, e.g. get students to do round-robin solution – each one just does one step. This may drive home the point of the importance of reasoning and ability to follow someone else’s line of thought.