Maths in Music

This task aimed to apply some of the things we’ve learned about Percentages, Data and Algebra within the context of music.  Here’s as it was given to the class.

I only wanted to do this for 2 lessons hence I chose the song and gathered the resources, even though I knew the girls could do that. The girls all love Taylor Swift and are learning to play the guitar in Music. I also knew that they’ve used all the ICT tools mentioned except for Wordle which some had Java problems with, WordItOut was a great alternative.  In fact, the girls found the most challenging part of this task is the mathematical component, i.e. finding patterns and expressing patterns using Algebra.

Note: This was not an assessment task, a mere immersion and contextualisation of maths, with some ICT integration. Not everyone submitted their work but pictures from those who did can be viewed on the class website.

——
Show me the maths in music!
Maths is everywhere even in music. There are patterns, rules, percentages and fractions. In this activity, we will attempt to capture some maths in music.
Work with your buddy to create a poster. We will vote on the best ones to be displayed for Open Day and uploaded to the class website. Winners will also get merits.
Posters will be judged on (1) visual appeal (2) relevant maths used and (3) completeness.

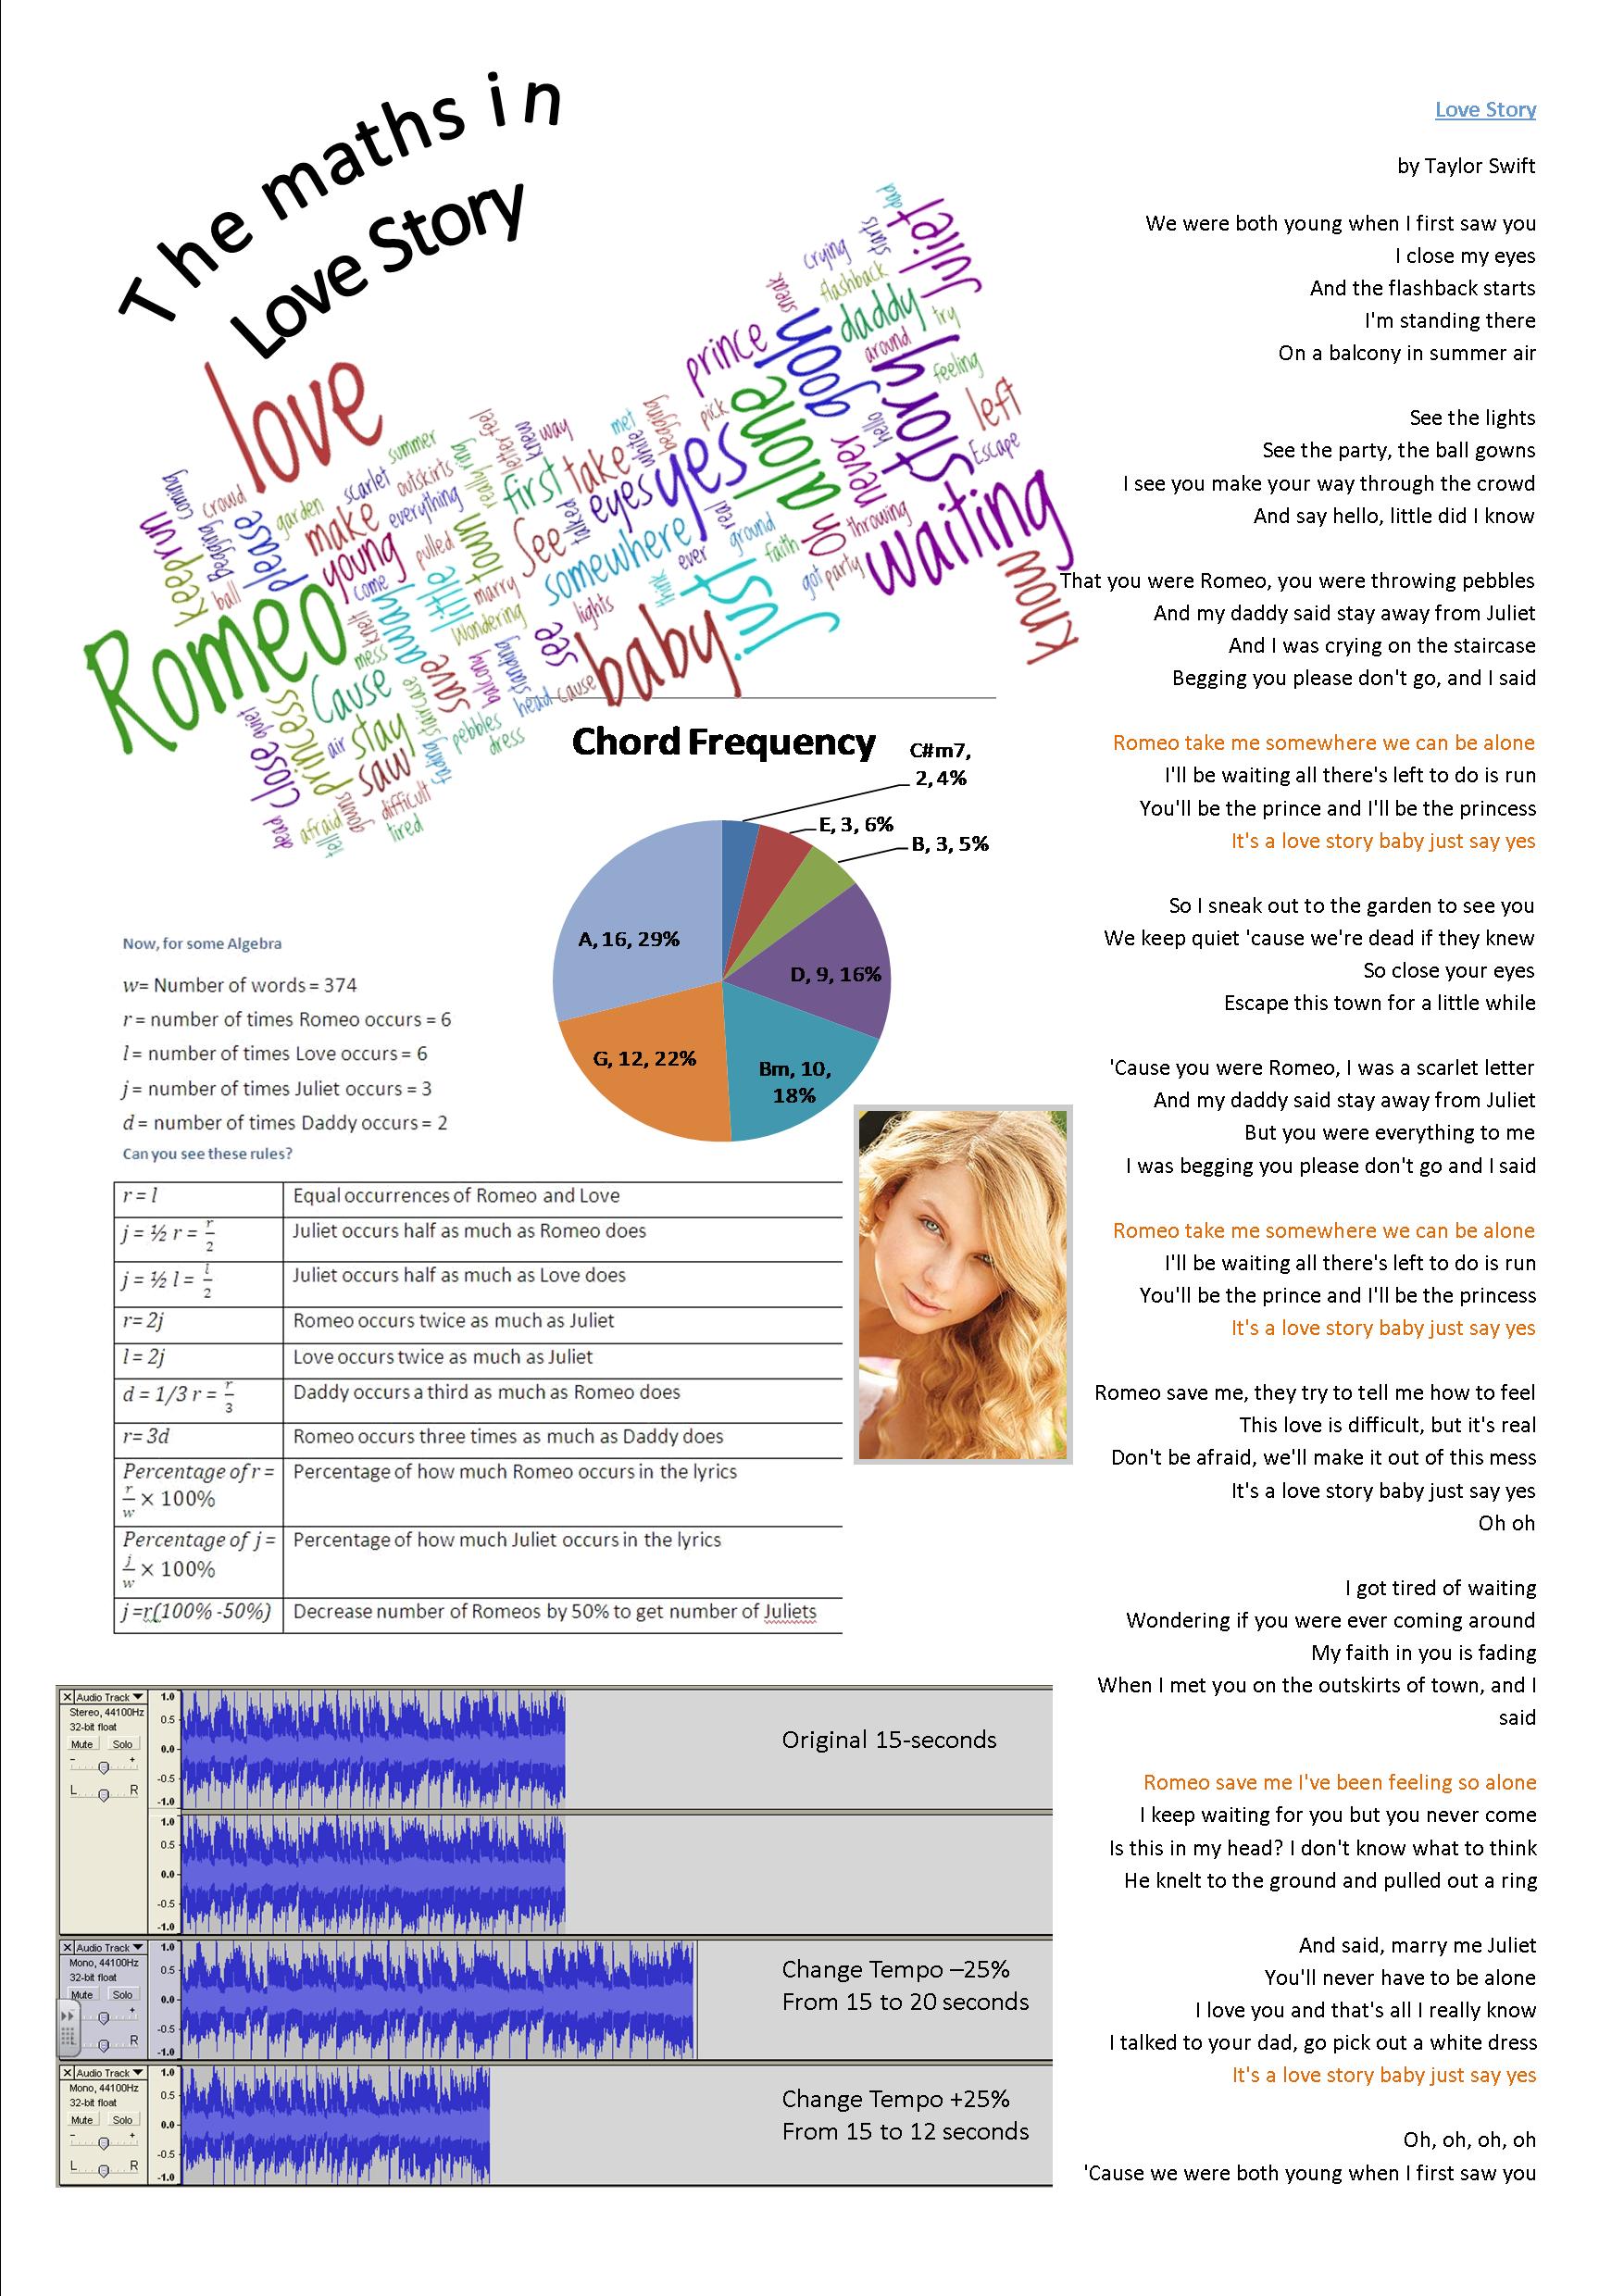
Here’s my work in progress using a different song, Love Story just to give you an idea.

Your song is also by Taylor Swift, The Best Day
Task Checklist (Lesson 1):

1. Get the lyrics of the song

2. Create a word cloud via Wordle; save as a jpg in Paint or PhotoShop. What are the most common words?

3. Have a copy of the lyrics in Word to count the number of words. Did Wordle get the percentages right?

Option 1

4. Use algebra to express the patterns and rules you see

5. Create a snapshot of your algebra rules; save as a jpg in Paint so your maths symbols look right on your poster

Option 2

4. Write 2 algebraic rules, e.g. 3x + 1, and show as a pattern in pictures

5. Save your rules and patterns as a jpg so your maths symbols look right on your poster

6. Put it all together into a poster using Publisher or PowerPoint with: (1) Word Cloud, (2) Lyrics, (3) Algebra rules, (4) a poster title, (5) 1-5 photos/images

7. Save and Upload to the Posters document library; use your first names as a filename

Task Checklist (Lesson 2):
You need to look at the Music Sheets (PDF) for this task.
  1. Tally the guitar chords used in the song. How many chords are there? Are there chord patterns?
  2. Create a Frequency Distribution Table and a Pie Chart in Excel. What is the mode?
  3. Add your pie chart to your original poster

Option 1

Save a copy of the song (mp3) to your desktop.

4. Import the song into Audacity and play with the Tempo. Create 3 mp3 versions of a 15-second grab: (1) original (2) faster (3) slower; you can choose the percentages but keep track of the numbers. What happens when you change the tempo?

5. Create a snapshot of your changed music and add to your poster. In textboxes, describe the changed music.

Delete the song from your desktop.

Option 2 (especially Music students)

4. Looking at the music sheets, find 3 – 4 mathematical patterns, e.g. Rhythm, Tempo and note values

5. Crop images and describe using both your knowledge of maths and music. Add to your poster.

For example: This bar has many notes, each one is played at 16th of a beat. Play 4 sixteenth notes or semiquavers for the time it takes to play a quarter note or crotchet. All the notes add up to 4 beats because….

Spreadsheets, Budgets and Formals

I’m not a big fan of spreadsheets – prefer databases more – but it needs to be taught. It can be a useful tool in life. Engaging and motivating low-ability year 10 maths students can be challenging the best of times. Here is a lesson I prepared that would teach them a life skill of budgeting using spreadsheets.

Lesson Activity

Year 10 formals is months away but this is something most year 10 girls are excited about. So when I said we’ll create a budget for it, everyone was excited to talk about something interesting.  Motivation covered!

  1. Brainstorm budget items (“What do I need for the formals?”) – emphasise no right or wrong answer, if not personally relevant then just set the budget to $0. The point of this step is to engage.
  2. Create a new spreadsheet and enter all the items under the heading of “What I need”. Good opportunity to revise basics of file creation/saving, renaming worksheet (Budget), data entry and Format-ting text and columns
  3. Add new columns with headings of Min, Max, Range (excellent chance to revise these statistical concepts). Each student enters their own budget, again no right or wrong. Format columns to currency.
  4. Calculate Range (=Max -Min columns); revise/teach use of Excel functions and autoFill.
  5. Calculate minimum and maximum budget totals; use autoSum or use SUM function
  6. With 9 months to go, create a monthly savings budget (=total / 9); some students don’t know the division symbol in Excel
  7. What are your cheapest (use MIN function) and most expensive (use MAX function) items
  8. Email your spreadsheet (make sure they all know how to attach files to email)

Discussion points

  • Can you afford your monthly budget (minimum, maximum)?
  • What adjustments can you make to afford the items? Are you working?
  • Would you consider borrowing or even doing without?
  • Would you negotiate with your parents? Can your budget spreadsheet help you talk to them?

Reflection

The girls enjoyed this lesson. The discussions were interesting and for my part, enlightening: truly amazing what teenagers deem they need and how different they all can be. They did not even mind the spreadsheet and statistics bit and were all keen to follow the flow of the lesson. They compared their results and even they were amazed at how different they all were.

I like this lesson because it was relevant, engaging and differentiated.

The Vitruvian Man – a context for learning

Finding a quantity given a percentage (or fraction) is a useful skill yet considered to be an extension topic for year 8. I thought I could give it a go but set the scene, so-to-speak, without the oft-used context of shopping and sales.

Enter the Vitruvian Man. Wikipedia has a good image and brief explanation of this drawing by Da Vinci interpreting ideal (hu)man proportions according to Vitruvius. Wikipedia also provides a list of these proportions.

Lesson Activity

My ‘hook’ question to the class was “How do forensic scientists figure out the height of victims given minimal data?”

I showed and explained the Vitruvian Man. We even managed to do a quick revision of properties of squares and how this was used in the drawing. Anyway, here’s how I used this “tool”.

  1. Divide the class into pairs (or small groups).
  2. For each pair, give a card which showed one of the proportions (e.g. 1/4 of height = shoulder width) as well as a measuring tape
  3. They take the fractional measurement of their partner, i.e. the item to the right of the equation, e.g. shoulder width
  4. Demonstrate how to calculate the height given a known percentage (or fraction); in my example, multiply each side of the equation by 4
  5. Finally, measure the actual height and compare to the calculated height

Discussion points

  • How do the actual and calculated height compare?
  • What are the reasons for differences?
  • Why multiply both sides (make a point to mention working with Algebra and equations)?

Reflection

The class really enjoyed the activity and didn’t really mind the ‘maths’ at all. Given that this class is deemed below-average, the level of engagement was good. The students – all girls – already associate percentages with sales but, for most if not all of them, this is the first time they’ve associated it with the human body. I know that I will use the Vitruvian Man again.

This was a lively lesson with talking and standing up and discussing. This isn’t every teacher’s cup-of-tea but it suits me just fine.

Percentage Composition

I wanted to make this lesson a bit more interesting as well as incorporate opportunities for connections with other maths topics.

I knew my year 8 class students loved music so I devised a very simple poll on Rob Thomas (one of the students was going to his concert): like him, don’t like him, don’t know him. This was a good opportunity to revise Frequency Distribution.

Just by fluke, our 3 fractions turned out percentages of recurring decimals (another connection). In that sense, it’s really not a very good first example! Anyway, someone asked if the percentages will total a hundred (I love it when they think!). So, we added and of course it didn’t. We got a result of 99.8%.  This opened up a discussion on the consequences of rounding/truncating decimals.

I made a statement that the most accurate way to represent not whole (fractional) values is via fractions. Nods all around until I asked, “‘Do you believe me?” The consensus was yes because I was the teacher. I was quick to point out that they should not always believe everything teachers say – they have to think if it’s reasonable; teachers are humans, after all, and can make mistakes. Besides, I really wanted to challenge my students to develop their thinking and reasoning.

So, I went back to the Frequency Distribution Table and 3 fractions. Adding the fractions naturally gave a total of 1 and nearly everyone said that’s 100%, as expected. Joy!

Were it a more able class (we stream our Maths classes), I could have pursued more connectionist opportunities but I did sense I’ve pushed enough today. I know I’ll refer back to this lesson when we actually do Data later in the school year. The class was engaged because they knew the meaning behind the numbers.

By the way, the statement is a fact I had truly learned in my previous career in IT. Particularly when I worked for a bank calculating interests, calculations in programs (software rather than curricular) were designed to stick to fractions as much as possible to minimise rounding errors.

In summary (more for my future reference),

Learning strategies: connectionism, motivation and engagement via meaningful and relevant examples, question/reason validity, compare/contrast

Fractions, Decimals and Percentages – provide different ways to represent fractional values, of which fractions are the most accurate