NCSS Challenge with a twist

I mentioned in my previous blog post (April 2020) the intent to share more resources to help computing teachers challenged with the uncertainties brought by the COVID-19 pandemic. Months later, the uncertainties are still there and I have yet to share more resources!

One day I’ll share my year 10 Data Science project and year 11 Software project. What I’d like to share now is my year 10 coding project because it incorporates Grok Learning’s NCSS Challenge. I’ve been using the challenge for years and always as part of an assessment. Nowadays, teachers can even claim participation as accredited training. That means doing the NCSS Challenge in Term 3 is accredited PD, covers teaching/learning/assessment of software programming unit (IST) with 24/7 tech support, and good for face-to-face as well as off-campus scenarios. That’s a WIN-WIN-WIN-WIN !

Here’s what I’ll be doing with year 10s.


Computational thinking is an approach to solving problems: designing solutions or algorithms that can be implemented using code. Are you good at understanding problems and creating logical solutions? Can you automate solutions by writing code?

Task:

Technical skills in focus for this task are algorithm design and representation, error correction, as well as coding solutions. The twist is that you will code and evaluate someone else’s design.


Part A – NCSS Challenge

NCSS Challenge begins on Monday 27 July 2020. You can choose either the Intermediate or Advanced stream. Completing the challenge constitutes training for algorithm design and coding. Completion rate will be marked accordingly.

The first three weeks of NCSS challenge will be used to practice for Part B of this task. That is, before our third lesson of the week, you must share to the class pool at least one of your algorithms for an NCSS Challenge problem that week. Algorithms should be desk-checked and represented either as pseudocode or flowchart. It should also have a test plan comprising expected output for test cases, including an educated guess of what the hidden test case(s) could be.

On the third lesson of the week, you will choose someone else’s algorithm to write python code for. You will also evaluate the quality of their solution design and test plan.

Timeliness and completeness of submissions will be marked. Quality of submissions will not be marked as you refine assessable skills. Use every opportunity for formative feedback to do well in Part B.

Part B – Algorithm design and coding challenge

  1. On 17 August 2020 (week 4 of NCSS Challenge), you will be given a list of Problems with 3 levels of difficulty to choose from. Choose one problem to design an algorithm for.
    1. Represent your algorithm as pseudocode AND flowchart
    2. Create a test plan with test cases and expected output
    3. Desk-check your algorithm
    4. Submit in Canvas Class Tasks designed solution by Wednesday 26 August 2020

You can submit earlier or do multiple submissions. For example, you may attempt several problems of increasing difficulty as you gain confidence and competence.

  1. From the list of available algorithms other than yours, choose one to code. It can be the same problem you designed for. The teacher will give you the documented design.
  2. Evaluate the design. Was it accurate or did you have to deviate from the documented algorithm to solve the problem? Were all test cases provided? Were the expected output appropriate? Was the desk check accurate? Substantiate your evaluation with specific details.


For both design and coding, difficulty level impacts marks. You may choose different levels for design and development, e.g. if you are more confident designing algorithms versus writing and testing code. Excellent completion of simple problems could still earn an ‘A’.


SUBMISSION: 

Weekly Part A submissions will be in our Microsoft Teams site where it is easy to share documents.

Design for Part B should be submitted in Canvas Class Tasks by 26 August 2020.

Submit the following Part B components to Canvas Assessments for marking:

  1. Algorithm solution and test plan
  2. Python code
  3. Evaluation of algorithm solution

 If you attempted several levels, please submit the highest level completed.


I’m still wondering what to do with year 9s but it will also involve NCSS Challenge. I really liked what I did last year which culminated in a feature post on Grok Learning blog (!!!!!). I have keen coders in this cohort so it’ll be a different experience again.

For more on how I use NCSS Challenge, check this post. Or you could always contact me here or on Twitter if you’d like to discuss further. I’d love that!

Print Friendly, PDF & Email

COVID-19 and Grok Learning

The COVID-19 pandemic has challenged many teachers including me with shifting from face-to-face on-campus teaching to an off-campus combination of synchronous and asynchronous learning. I thought I’d do my bit for the computing teachers community by sharing my resources.

My first (hoping to share more) installment is for IST. This one is for my year 9s for the Internet and Web Development option. I always run this unit in line with Grok Learning Web.Comp. That it suits off-campus learning is a bonus. Thank you Grok Learning!!!

The Task

In groups of 3, students will design and develop interactive websites. There are deliverables for the team as well as team members. They all have to do Web.Comp to upskill and then apply immediately to their project. Here’s the complete task including schedule and rubric mapped to outcomes (see below). I keep my rubric simple with specific criteria on what I’m looking for.

[embeddoc url=”https://malyn.edublogs.org/files/2020/04/2020-9IST-Task-2-Web-Design.pdf” width=”75%” download=”all” viewer=”google” ]


In groups

  • Choose their own topic inspired by pages from our school diary. It covers study skills, well-being, school history. This content is relevant more than ever and I do not have to worry about allocating time for research which really isn’t the focus of my assessment.
  • Choose their own audience; specific is best, e.g. year 9 student who loves checklist
  • Decide on a Site Map, i.e. what pages and features to include
  • Decide on a joint Style Guide

Individually

  • Find their own inspiration before contributing back to the team
  • Define one success criterion based on the Web Content Accessibility Guidelines (WCAG); #a11y is a thing! and a practical way of engaging with ethical issues
  • Create a prototype so they can refine their Style Guides prior to submission – and see the cascading bit on CSS in action (and likely frustration but that’s all part of learning!)
  • Log progress (Medals and Missions) for self-regulation purposes as well as to help me keep track of their progress (evidence of engagement and understanding, in teacher-speak)


a bit more context

I’ve asked my students to do Grok Learning’s Intro to HTML/CSS course late last term. Most have done about 50% of the course and all of them are familiar with the interface. This is why I chose Advanced stream.

My off-campus classroom is in Microsoft Teams, with a channel for Virtual Lessons. This worked well at the end of last term. Now, I’ve added breakout channels (this post from Alice Leung is helpful if you want to learn how I set it up plus a few other tips there) for each project team as I intended this task to be group work. I considered using GitHub but since I haven’t walked my students through setting it up – and I’m not all that confident in trouble-shooting, I decided to stick to files in Teams. I’ll have to show them how to sync so they can do offline development.

I usually do backward-planning, i.e. starting from outcomes and then create learning experiences accordingly. Here are the outcomes I intend to assess:

5.2.2 Designs, produces and evaluates appropriate solutions to a range of challenging problems

5.2.3 Critically analyses decision-making processes in a range of information and software solutions

5.3.2 Acquires and manipulates data and information in an ethical manner

5.5.1 Applies collaborative work practices to complete tasks

Here’s my planned Term 2 schedule including weeks before and after the assessment and Web.Comp. Not sure what the NSW plan of staggered return will do to this plan but I think it might just be resilient enough!

[embeddoc url=”https://malyn.edublogs.org/files/2020/04/9IST-Term-2-Schedule.pdf” width=”75%” download=”none” viewer=”google” ]


Old posts that could be useful

Here’s a post I wrote for more on how I use Grok Learning in my teaching. Grok Learning is free until July. That’s another bonus!

Here’s a post on how I do my backward planning – this one’s on a unit for Year 11 Software Design and Development.

Print Friendly, PDF & Email

PBL with NCSS Challenge from Grok Learning

I am such a big fan of Grok Learning and NCSS Challenge. It’s been an integral part of my teaching Information Software and Technology (IST) since 2013. Every year, the challenge is the foundation of my assessment tasks so my IST Scope and Sequence always has Software Design and Programming in Term 3 when the challenge is on. Though the foundation is the same, each task is different and over the years, I’ve explored many of the features provided. (Read what’s new this year from Grok Learning’s blog).

Apart from enjoying learning fundamentals of programming as well as coding in python, I really want my year 9 IST students to be more aware of, and appreciate:

  • growth in their learning
  • diversity in solutions
  • personal relevance of computational thinking and coding

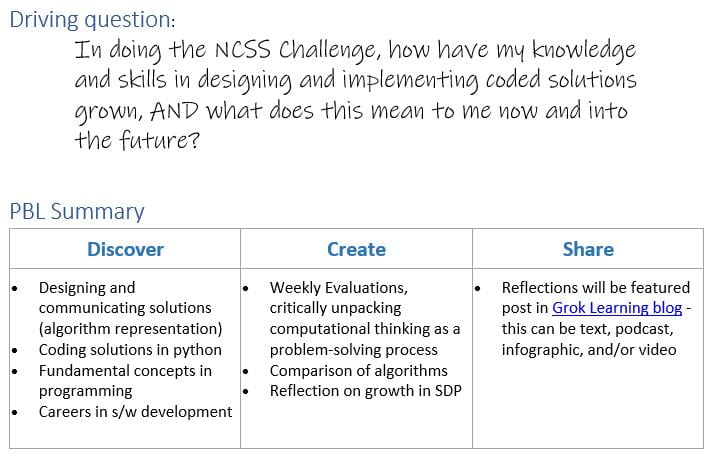
In other words, I want deeper learning. I decided to plan this slightly differently using my two go-to PBL-planning frameworks (1) student-friendly format from Bianca and Lee Hewes, and (2) teacher-programming familiar format from Setting the Standard for PBL: A Proven Approach to Rigorous Classroom Instruction.  This is a similar approach to another unit I loved – Delta X (my X + CS project with year 11 Software Design class).

In doing the NCSS Challenge, how have my knowledge and skills in designing and implementing coded solutions grown, AND what does this mean to me now and into the future?

Thank you Grok Learning for agreeing to feature my students’ work, providing an authentic audience 🙂


I’ve not had a chance to make it all pretty. I decided to share now in case others doing the challenge are looking for ideas to use it in their assessments this term. I’m using a class OneNote notebook (I’m also a big OneNote fan) but have PDF’d relevant details, including literacy/writing scaffolds, to share as well. The textbook referred to here is by David Grover et al, it is a good reference to augment the notes from the challenge, and it aligns well with NSW’s syllabus.

[embeddoc url=”https://malyn.edublogs.org/files/2019/07/2019-9IST-NCSS-Challenge-plan.pdf” download=”all” viewer=”google” ]


I think it’s pretty self-contained but happy to clarify if needed.

Suggestions for improvement are also welcome! Even if it’s too late for me to change this year, there’s always next year 🙂


Print Friendly, PDF & Email

Share the awesome

AI PBLI’m not gonna lie. When DTHub asked if I could share my story about a recent PBL unit with IST, I squealed with excitement. Validation, right? Usually I just share here but DT Hub has a much bigger audience than my blog!

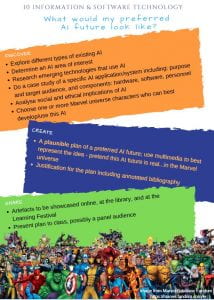
The story is up – What would my preferred AI look like?  There’s no point re-posting here so please go there to read the story, download resources including assessment task details, and  view exemplars – plus some tips on adjustments you can make to it.

I was excited planning this PBL and tweeted this poster on the left a lot. Running it got frustrating at times – as projects sometimes (often?) do. But the students engaged, and persevered, and rose above feelings of confusion and frustration. The result was a triumph in teaching and learning which I was glad and proud to share more widely.

The story in DT Hub is not complete though. There are more awesome stories to tell, e.g.

  • a student who previously struggled with completing assessments on time, if at all, did so this time
  • a student who spent an inordinate amount of time on one aspect of the project, to the detriment of some of her other subjects reminds me that, like adults, students juggle and prioritise and will go beyond expectations when motivated by personal interests (that’s a long sentence!)
  • a recent Twitter connection, Erica Southgate, whom I’ve not personally met (yet) connected ESA/DTHub and me. What little she knew of my work, she thought good enough to be worth sharing. Awesome, right?
  • some parents of these girls told me how it opened up interesting discussions at home AND some even offered opportunities like excursions and connections to other IT professionals. Yay!
  • the hope @smerity gave us regarding ‘dual use technology’ such as AI: while we cannot eliminate the bad, maybe we can drown it out with the good. As a tech teacher, I live for this hope, that my students will believe they can help build a preferred future (yes, I’m assuming it is good)!

That last point is a salient one and the reason for the blog post title. There are so many negative stories around and it’s important to share positive ones. I really believe that everyone has awesome stories to share: face-to-face or online.

We all need to share more of the good stuff because this is the stuff that gives us – and our students – hope for a better future, and that education can help us get there. I think this quote I shared on my post about (action-research on) hope is appropriate to re-share:

…if openly shared and freely distributed, hope can spread throughout the community. –  James Arvanitakis

#ShareTheAwesome


Someone gifted me this perspective a while ago as I battled with impostor syndrome (this nasty voice inside that refuse to just leave me alone for good). Putting this video  here again in case you need it to be convinced that you have something awesome to share. We all do.

Print Friendly, PDF & Email

Data Data Data

Data fascinates me. Ironically, much as I enjoyed mathematics in high school, I did not enjoy Statistics and Probability – strands that haunt me particularly in my professional life. Another ironic thing is that while I enjoyed working with databases in my previous career in IT (I love SQL), I’ve not really ‘taught’ databases in high school computing in a way that genuinely shares this joy.

This post is not about Stats, Probability, or databases but rather something more fundamental.

This post is about data and, in particular, some novel ideas I’ve heard/read lately about what data is…and I’m fascinated even more!

3 ways to spot a bad statistic

in this TED talk, Mona Chalabi is charmingly entertaining as she unpacks the problem with polls and averages, as well as people’s perception of data. The thing about averages is not new to me but I love her (new to me) rationale for her hand-drawn visualisation which strengthens her strategies for spotting dodgy data. I teach these data concepts but I love the (new to me) way of framing them.

Can you see uncertainty?

There’s usually a big emphasis on data accuracy and precision (oh the beauty and irony of floating point representation in computers). Chalabi points out this problem when dealing especially with human behavioural data (ha! Recall my action-research on well-being). And truly, sometimes we got hung up on quantification and numbers, sometimes losing sight of the real story the data is trying to tell.

Can you see yourself in the data?

The second point is interesting because it’s not just about whether data is personally relevant. But rather, it’s to do with granularity and visualisation techniques, particularly when only aggregated data is shown. People cannot be summed into one data point so it makes sense to look for other data points or perspectives or axes, e.g. over time or split into gender.

How was the data collected?

If there’s anything I learnt from working with decision-support systems it’s this, be careful what questions you ask as the answers you get may not be what you’re after in the first place…and the good ‘ol “rubbish in, rubbish out“. This point is certainly about the source and process of data collection but more importantly, it is about data integrity.

Data Humanism

I stumbled on this term as only one can in the wonderful world of hypertext. Internet serendipity is a thing! This post on Data Humanism by Giorgia Lupi was an eye-opener.

Data Humanism by @giorgialupi

Connect data to what they stand for: humans – people, behaviour, knowledge

Lupi extols ‘Embrace complexity’. Here I am, schooled in the idea of ‘keep it simple so the audience gets it’ but,

We can write rich and dense stories with data. We can educate the reader’s eye to become familiar with visual languages that convey the true depth of complex stories.

And here’s me scratching my head why school reports show a bunch of numbers and letters, maybe some written comments, that quite often fail to tell the ‘true depth of complex stories’. Context is usually missing because (I know) it’s in the ‘too hard basket’.

So, here is the challenge I’m setting for myself:

Data, if properly contextualized, can be an incredibly powerful tool to write more meaningful and intimate narratives.


I’ve got such a long, arduous and exciting learning journey ahead of me!


Print Friendly, PDF & Email